One Example Three Languages

I wanted to post this example of my Google Summer of Code work because I think it’s neat. One of the cool things about Shogun is our great SWIG wrapper and our static interface which lets us use Shogun natively in a bunch of different languages. So here is an example program of doing Blind Source Separation using the Jade algorithm from Python, Octave and R:

"""
Blind Source Separation using the Jade Algorithm with Shogun
Based on the example from scikit-learn
http://scikit-learn.org/

Kevin Hughes 2013
"""

import numpy as np
import pylab as pl

from shogun.Features  import RealFeatures
from shogun.Converter import Jade

# Generate sample data
np.random.seed(0)
n_samples = 2000
time = np.linspace(0, 10, n_samples)

# Source Signals
s1 = np.sin(2 * time)  # sin wave
s2 = np.sign(np.sin(3 * time))  # square wave
S = np.c_[s1, s2]
S += 0.2 * np.random.normal(size=S.shape)  # add noise

# Standardize data
S /= S.std(axis=0)  
S = S.T

# Mixing Matrix
A = np.array([[1, 0.5], [0.5, 1]])

# Mix Signals
X = np.dot(A,S)
mixed_signals = RealFeatures(X)

# Separating
jade = Jade()
signals = jade.apply(mixed_signals)
S_ = signals.get_feature_matrix()
A_ = jade.get_mixing_matrix();

# Plot results
pl.figure()
pl.subplot(3, 1, 1)
pl.plot(S.T)
pl.title('True Sources')
pl.subplot(3, 1, 2)
pl.plot(X.T)
pl.title('Mixed Sources')
pl.subplot(3, 1, 3)
pl.plot(S_.T)
pl.title('Estimated Sources')
pl.subplots_adjust(0.09, 0.04, 0.94, 0.94, 0.26, 0.36)
pl.show()
% Blind Source Separation using the Jade Algorithm with Shogun
%
% Based on the example from scikit-learn
% http://scikit-learn.org/
%
% Kevin Hughes 2013

% Generate sample data
n_samples = 2000;
time = linspace(0,10,n_samples);

% Source Signals
S = zeros(2, length(time));
S(1,:) = sin(2*time);
S(2,:) = sign(sin(3*time));
S += 0.2*rand(size(S));

% Standardize data
S = S ./ std(S,0,2);

% Mixing Matrix
A = [1 0.5; 0.5 1]

% Mix Signals
X = A*S;
mixed_signals = X;

% Separating
sg('set_converter', 'jade');
sg('set_features', 'TRAIN', mixed_signals);
S_ = sg('apply_converter');

% Plot
figure();
subplot(311);
plot(time, S(1,:), 'b');
hold on;
plot(time, S(2,:), 'g');
set(gca, 'xtick', [])
title("True Sources");

subplot(312);
plot(time, X(1,:), 'b');
hold on;
plot(time, X(2,:), 'g');
set(gca, 'xtick', [])
title("Mixed Sources");

subplot(313);
plot(time, S_(1,:), 'b');
hold on;
plot(time, S_(2,:), 'g');
title("Estimated Sources");
# Blind Source Separation using the Jade Algorithm with Shogun
#
# Based on the example from scikit-learn
# http://scikit-learn.org/
#
# Kevin Hughes 2013

library('sg')

# Generate sample data
n_samples <- 2000
time <- seq(0,10,length=n_samples)

# Source Signals
S <- matrix(0,2,n_samples)
S[1,] <- sin(2*time)
S[2,] <- sign(sin(3*time))
S <- S + 0.2*matrix(runif(2*n_samples),2,n_samples)

# Standardize data
S <- S * (1/apply(S,1,sd))

# Mixing Matrix
A <- rbind(c(1,0.5),c(0.5,1))

# Mix Signals
X <- A %*% S
mixed_signals <- matrix(X,2,n_samples)

# Separating
sg('set_converter', 'jade')
sg('set_features', 'TRAIN', mixed_signals)
S_ <- sg('apply_converter')

# Plot
par(mfcol=c(3,1));

plot(time, S[1,], type="l", col='blue', main="True Sources", ylab="", xlab="")
lines(time, S[2,], type="l", col='green')

plot(time, X[1,], type="l", col='blue', main="Mixed Sources", ylab="", xlab="")
lines(time, X[2,], type="l", col='green')

plot(time, S_[1,], type="l", col='blue', main="Estimated Sources", ylab="", xlab="")
lines(time, S_[2,], type="l", col='green')

Successfully Defended my Thesis!

Hitting the thesis gong in the Queen's Print center when I submitted last month

After 2 long and intense years of work yesterday I defended my thesis titled Subspace Bootstrapping and Learning for Background Subtraction. Grad School has been a blast but I’m definitely looking forward to employed life!

I’ll post a link to my thesis under publications as soon as Queen’s uploads it to their system.

*edit* the link to my thesis is on my publications page

Building a DAQ with an Arduino

A quick Google search of Arduino+DAQ will return a ton of results but none of them seemed to do quite what I was looking for. There are lots of websites explaining how you can use an Arduino to build a very inexpensive DAQ (Data Acquisition) instead of using a commercial product which would be expensive. This is a great idea and the Arduino is more than capable of logging data for practical purposes and there are a lot of great existing projects out there. However in my opinion they were all too “Arduino-ie” (logging to sd cards, or printing directly to a serial lcd screen etc.) and kind of fail to hit the right market. That is why this project was born!

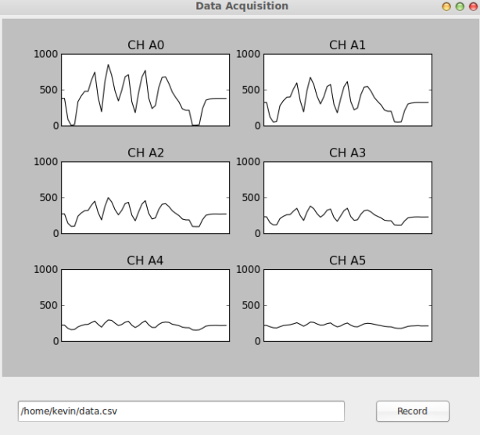
In truth this isn’t really much of an Arduino project it’s more of a python project - I set out to create a proper gui interface for using the Arduino as a DAQ. The Arduino program itself is very simple, it reads each analog pin and sends the data over serial. The real magic is what happens on the other end - a python program receives the data and plots each analog channel in real-time, sort of what you’d expect using a tool like Labview. There is also a text field where a file name can be entered and a button to begin saving the data to your computers hard drive in csv format. The program looks like this:

gui

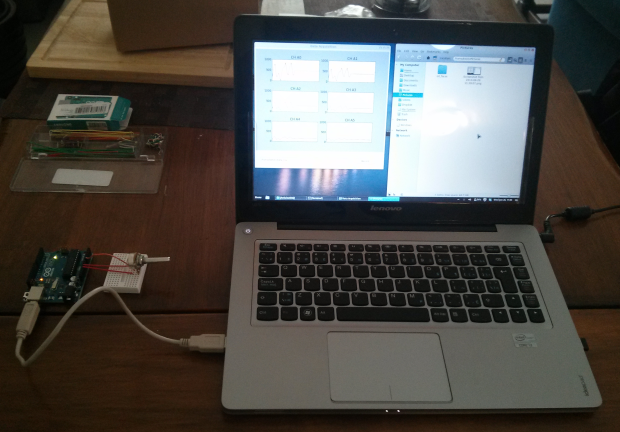
I rigged up a little test bed for my Arduino DAQ using my new Arduino and a potentiometer. Here is a photo of my setup:

setup

The full source code for both the python program and the Arduino program are on my GitHub account:   

github.com/kevinhughes27/arduinoDAQ 

please use, improve and give me some feedback!